Key Takeaways
- Nvidia's earnings reignited the AI trade. A 106% surge in revenue restored confidence in the durability of the AI cycle, lifting technology stocks and driving strong gains across Growth, ESG and Izdihar portfolios.
- Commodities came roaring back. Geopolitical tensions and El Nino-driven supply concerns fuelled rallies in precious metals, energy, resources and agriculture, making them some of the month's strongest-performing assets.
- The biggest surprise was fixed income. Despite higher US Treasury yields and a weaker US dollar, the MYTHEO Income Portfolio delivered positive returns, with all eleven underlying holdings posting gains in USD terms.
Monthly Returns Summary
The following table summarises the performance of all MYTHEO portfolios for August 2026:
1. Omakase Portfolios
Omakase combines Growth, Income & Inflation Hedge in an optimised weightage proportion that is personalised according to your risk profile. Your return is the weighted sum of these three functional portfolios.
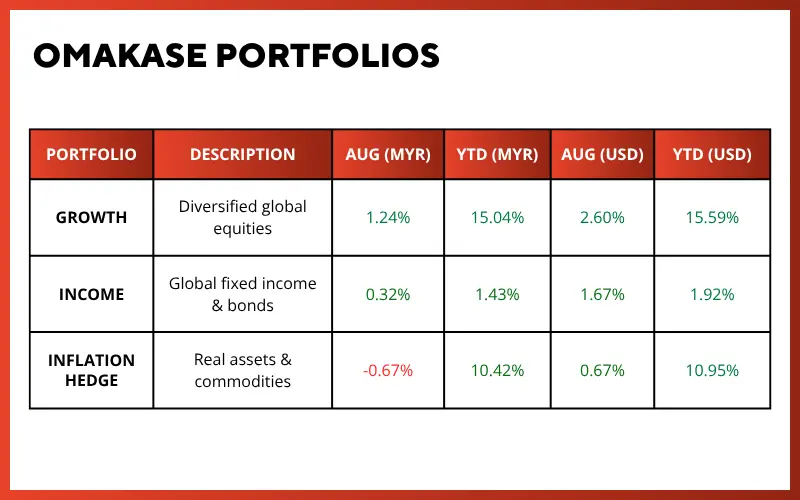
*Source: GAX MD Sdn Bhd, data in USD term for the month of August 2026
Past performance is not an indication of future performance.
2. Satellite Portfolios
Global ESG, Essential Products, and Izdihar are standalone portfolios — each with its own investment theme. They can be held independently or alongside an Omakase allocation.
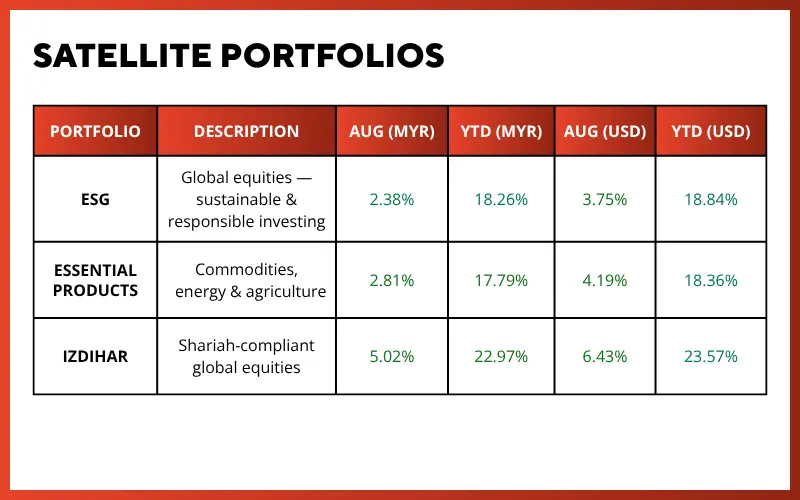
*Source: GAX MD Sdn Bhd, data in USD term for the month of August 2026
Past performance is not an indication of future performance.
3. MYTHEO Portfolio YTD Returns in MYR
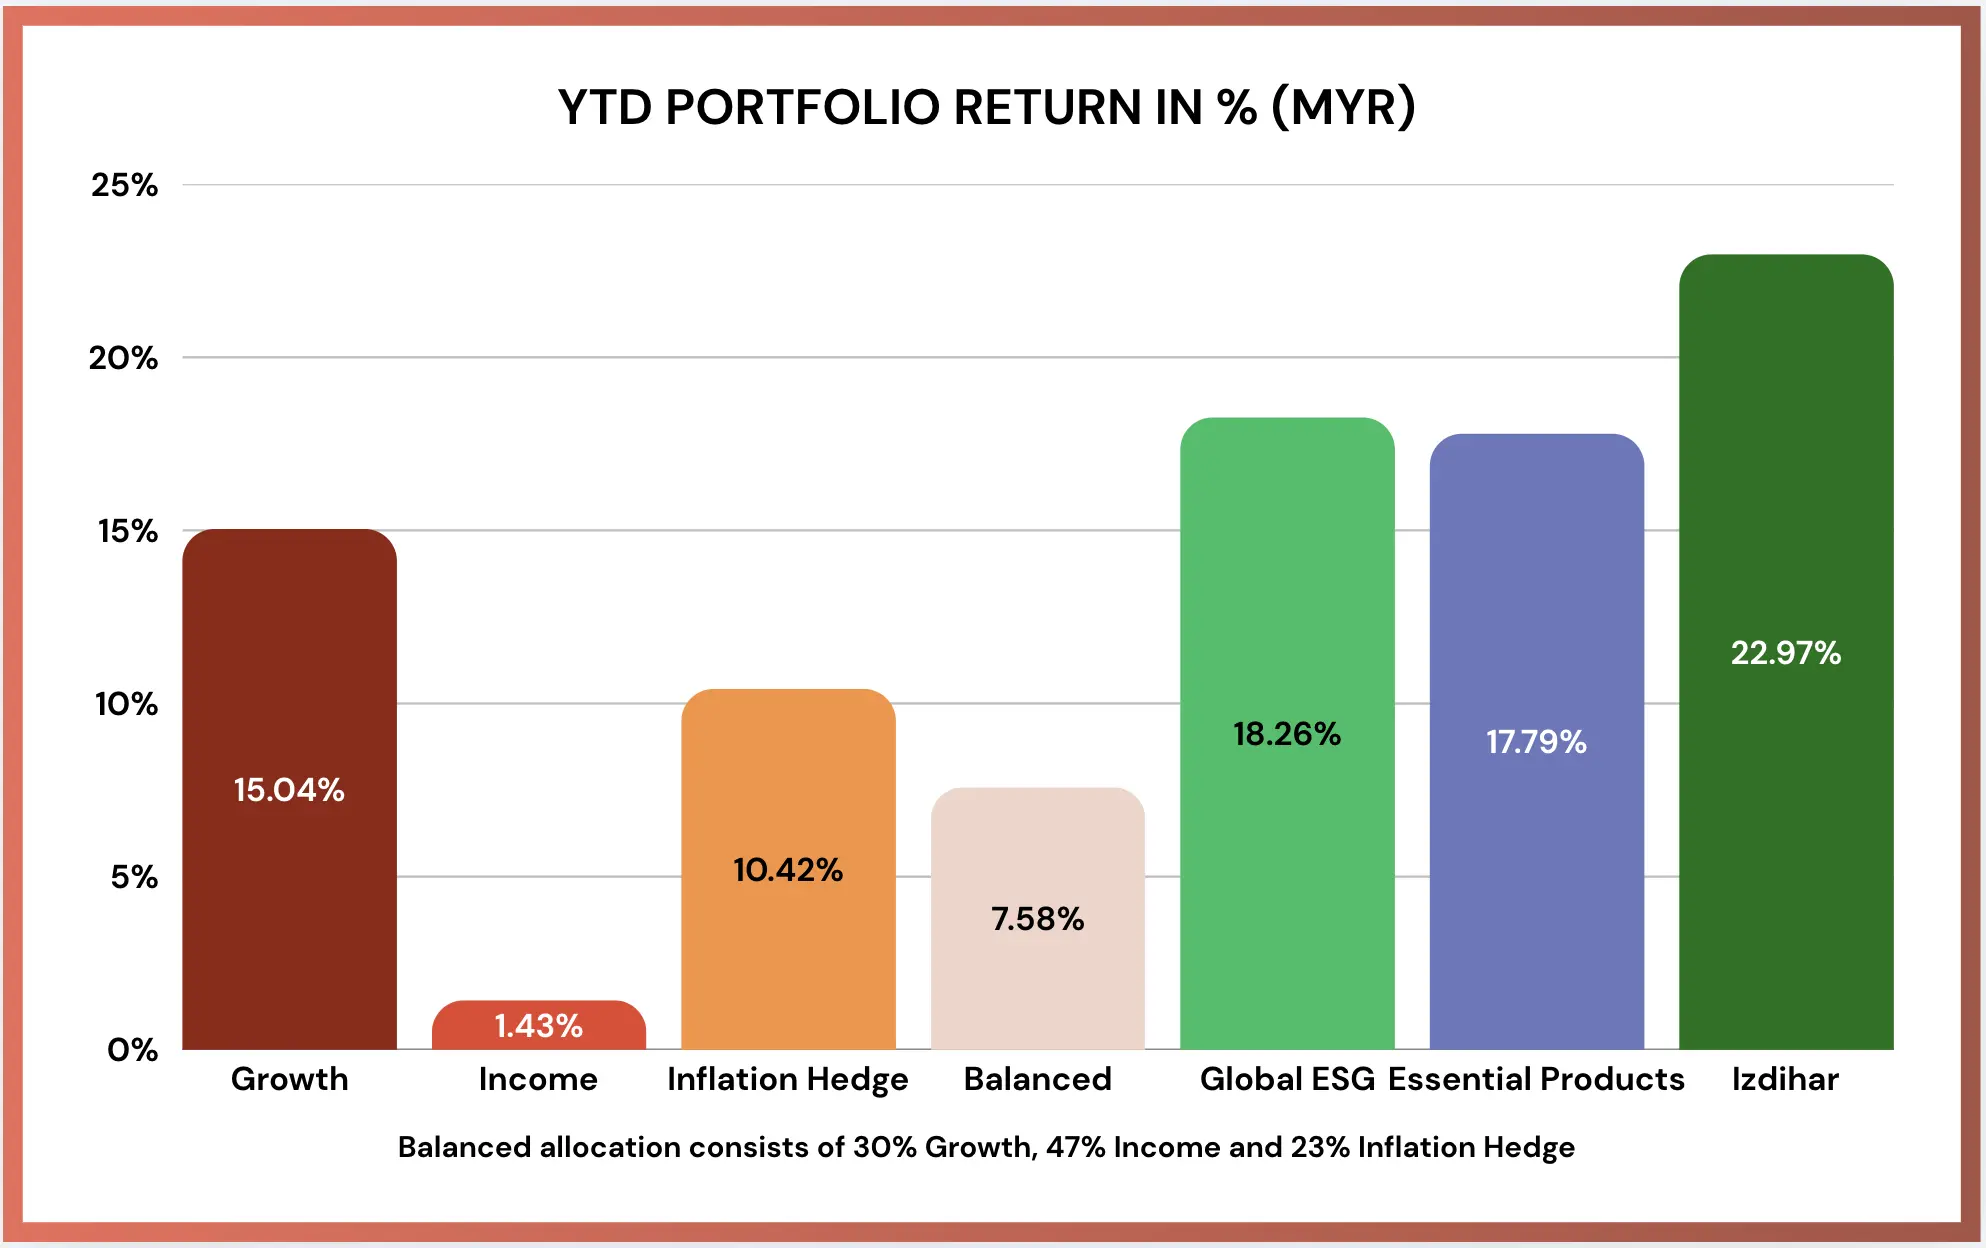
*YTD = Year to Date
*Source: GAX MD Sdn Bhd, data in USD term for the month of August 2026
Past performance is not an indication of future performance.
HOW TO CALCULATE YOUR OMAKASE RETURNS
Your Omakase return is the weighted sum of each portfolio's monthly return. Using the balanced allocation as an example:
Using the Balanced allocation as an example, with 30% Growth, 47% Income and 23% Inflation Hedge, a Balanced Omakase returned approximately 6.37% YTD in MYR as of 30 July 2026. Your actual return varies with your personal allocation and investment timing.
Your actual return varies based on your personal allocation and investment timing.
Performance Commentary
August marked a significant turnaround for the technology sector following several months of weakness. The key catalyst was Nvidia's latest earnings release, in which the company reported a 106% year-over-year increase in quarterly revenue. Founder and CEO Jensen Huang described artificial intelligence as having reached an inflection point, emphasizing that AI-generated tokens are now both productive and profitable. He further noted that AI applications are already generating meaningful revenue and that demand continues to accelerate.
The rebound in technology shares helped improve overall investor sentiment and renewed appetite for risk assets. As confidence returned to the market, investors increased exposure to commodities and cyclical sectors. Commodities broadly in the rally, with metals, resources, and agricultural delivering particularly strong gains during the month.
1. Equities Rebound Across Growth, ESG and Shariah Portfolios
The improvement in market sentiment was reflected across our equity-focused portfolios, particularly those with meaningful exposure to growth and technology-related themes.
Unsurprisingly, Izdihar was the strongest-performing portfolio during the month, advancing 5.02% in MYR terms. The portfolio was a clear beneficiary of the technology-led rally, with all five underlying holdings delivering positive returns. Even its weakest contributor, global Islamic equities (UMMA), posted a respectable gain of 3.69%.
The Growth Portfolio rose 1.24% in MYR, supported by its allocation to growth-oriented assets and international equities. However, gains were partially offset by weaker performance from value-oriented holdings. Pacific equities (VPL) and large-cap growth stocks (VUG) delivered strong returns, while value stocks lagged. Mid-cap value stocks (VOE) recorded a small loss, and small-cap value stocks (VBR) ended the month with only marginal gains.
The ESG Portfolio also turned in a strong performance, rising 2.38% in MYR terms and 3.75% in USD terms. Every holding within the portfolio generated positive returns during August.
Strong gains in Asian technology stocks supported the portfolio's emerging market exposure, with ESG Emerging Markets (ESGE) leading the portfolio's holdings with a return of 4.79%. Unlike the Growth Portfolio, however, ESG value-oriented holdings were more resilient. ESG large-cap value stocks (NULV) gained 3.91%, while ESG mid-cap value stocks (NUMV), despite being the weakest performer within the portfolio, still delivered a positive return of 1.34% for the month.
2. Commodity Winners Outshone Real Estate and Infrastructure
The Inflation Hedge Portfolio declined 0.67% in MYR terms during the month, primarily due to the weaker US dollar. In USD terms, however, the portfolio delivered a positive return of 0.67%.
Performance across inflation-sensitive assets was generally positive. Precious metals emerged as the primary contributors, with silver (SLV) and gold (IAU) advancing 14.84% and 9.90%, respectively, as both rebounded strongly after several months of underperformance. Agriculture (DBA) also extended its positive momentum, gaining 6.58%.
Despite these strong advances, overall portfolio performance was partially offset by weakness in international real estate (RWX), global infrastructure (IGF), and US real estate (IYR), all of which declined by more than 2% during the month. The combination of a risk-on market environment and higher sovereign bond yields reduced investor appetite for defensive and income-oriented assets, leading to underperformance across these sectors.
The Essential Products Portfolio was the second-best performer of the month after MYTHEO Izdihar, rising 2.81% in MYR terms and 4.19% in USD terms. Performance was driven primarily by resource, energy, and agricultural exposures as investors positioned for a more uncertain geopolitical and commodity backdrop.
Lithium and battery technology (LIT) was the standout contributor, gaining 10.33%, while the energy sector (XLE) advanced 7.41% amid heightened concerns over developments in the Middle East and their potential impact on global energy markets. Agricultural producers (VEGI) also delivered a strong return of 7.20% as El Nino-related weather disruptions raised expectations of tighter crop supplies and higher food prices.
3. Income Portfolio Delivered Positive Returns Despite Double Headwinds
At first glance, market conditions appeared unfavourable for the Income Portfolio. US Treasury yields ended the month at their highest level since October 2023, while the US dollar weakened by more than 1.40% against the Malaysian ringgit. Together, these developments typically represent a double headwind for an income portfolio with high exposure in USD.
Despite these challenges, the MYTHEO Income Portfolio generated a positive return of 0.32% in MYR terms and 1.67% in USD terms. In fact, all eleven underlying holdings generated positive returns in USD terms, demonstrating the broad-based strength across the portfolio. Even US Treasury allocations delivered positive returns despite concerns surrounding rising bond yields. Long-duration Treasuries (TLT) gained 0.73%, while intermediate-duration Treasuries (IEI) rose 0.06%.
4. Conclusion
August was shaped by four powerful market catalysts, each influencing a different segment of the investment landscape. The first was Nvidia's earnings release, which effectively put an end to concerns that enthusiasm surrounding artificial intelligence had run ahead of fundamentals. The company's results reaffirmed that the AI investment cycle remains intact, triggering a broad rally in technology stocks and growth-oriented assets worldwide.
The second and third catalysts came from outside financial markets. Escalating geopolitical tensions in the Middle East supported energy and resource-related investments, while the ongoing El Nino phenomenon drove agricultural commodity prices higher on concerns over tighter food supplies. These developments provided a favourable backdrop for the MYTHEO Essential Portfolio, whose exposure to energy, resources and agriculture contributed meaningfully to performance during the month.
The fourth catalyst was less favourable on the surface. Global sovereign bond yields continued to move higher, with the US 10-year Treasury yield reaching its highest level since October 2023. Combined with a weaker US dollar against the Malaysian ringgit, the environment appeared particularly challenging for investors holding USD-denominated fixed income assets.
Despite these headwinds, the MYTHEO Income Portfolio delivered positive returns in MYR terms, while all eleven underlying holdings generated positive returns in USD terms.
*This material is subject to MYTHEO's Notice and Disclaimer. All performance figures are net of management fees. Past performance is not indicative of future results.
Appendix
ETF Performance Summary by Portfolio | August 2026
1. Growth Portfolio
RISK: HIGH | Diversified global equities
2. Income Portfolio
RISK: LOW | Global fixed income & bonds
3. Inflation Hedge Portfolio
RISK: MEDIUM | Real assets & commodities
4. ESG Portfolio
RISK: HIGH | Global equities — sustainable & responsible investing
5. Essential Products Portfolio
RISK: HIGH | Commodities, energy & agriculture
6. Izdihar Portfolio
RISK: HIGH | Shariah-compliant global equities
*Returns are in USD terms for the month of August 2026.
Top and Bottom performers ranked by 1-month return within each portfolio. Past performance is not indicative of future results.
Ready to explore how MYTHEO works for your goals? Learn more here.
Or download our app so you can start investing in a moment. Download on iOS here or Android here.
*This material is subject to MYTHEO's Notice and Disclaimer. All performance figures are net of management fees.
Past performance is not indicative of future results.
This material is subject to MYTHEO’s Notice and Disclaimer.