Key Takeaways
- May delivered broad-based positive returns across the majority of MYTHEO portfolios, with five of seven strategies posting gains in Ringgit terms. The rally was driven by a significant surge in technology stocks and improving geopolitical sentiment.
- The MYTHEO Izdihar Portfolio led all strategies with an exceptional return of 10.25% in MYR (19.57% in USD), fuelled by its concentrated exposure to the semiconductor and technology sector. The ESG and Growth portfolios also benefited meaningfully from the technology rally.
- Energy and commodity-linked positions faced headwinds as oil prices declined sharply on hopes of a US-Iran ceasefire agreement. This weighed on the Essential Products and Inflation Hedge portfolios, which recorded modest declines.
- Year-to-date returns remain strongly positive across all equity-focused portfolios, reinforcing the case for maintaining disciplined exposure through the volatility witnessed in the first quarter of 2026.
Monthly Returns Summary
The following table summarises the performance of all MYTHEO portfolios for May 2026:
1. Omakase Portfolios
Omakase combines Growth, Income & Inflation Hedge in an optimised weightage proportion that is personalised according to your risk profile. Your return is the weighted sum of these three functional portfolios
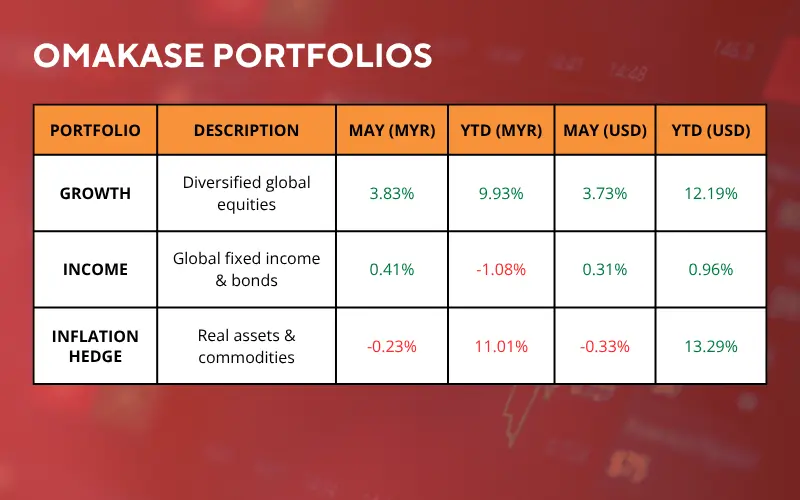
*Source: GAX MD Sdn Bhd, data in USD term for the month of May 2026
Past performance is not an indication of future performance.
2. Satellite Portfolios
Global ESG, Essential Products, and Izdihar are standalone portfolios — each with its own investment theme. They can be held independently or alongside an Omakase allocation.
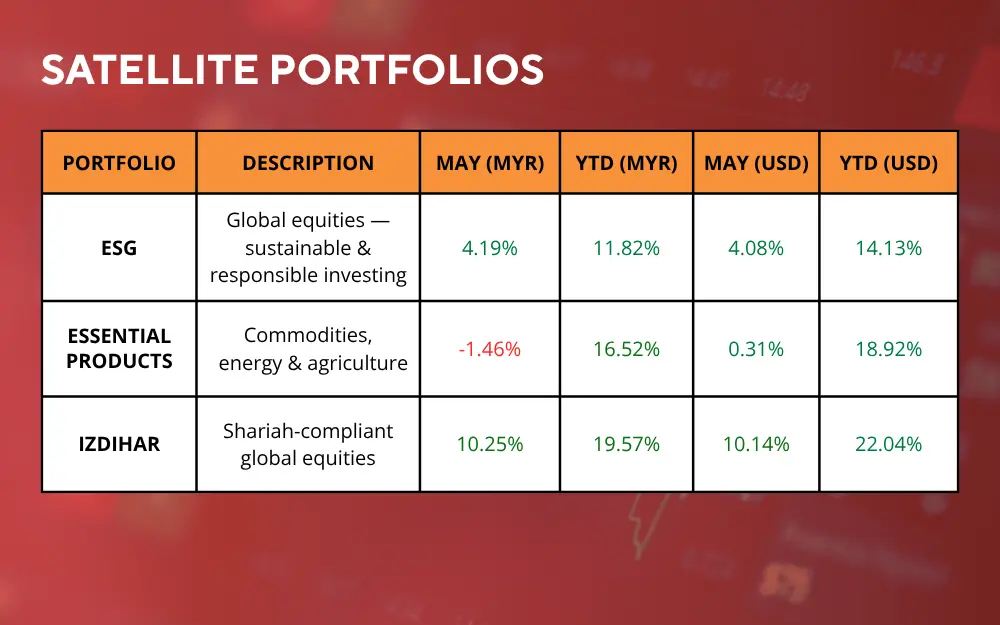
*Source: GAX MD Sdn Bhd, data in USD term for the month of May 2026
Past performance is not an indication of future performance.
3. MYTHEO Portfolio YTD Returns in MYR
(as of 31 May 2026)
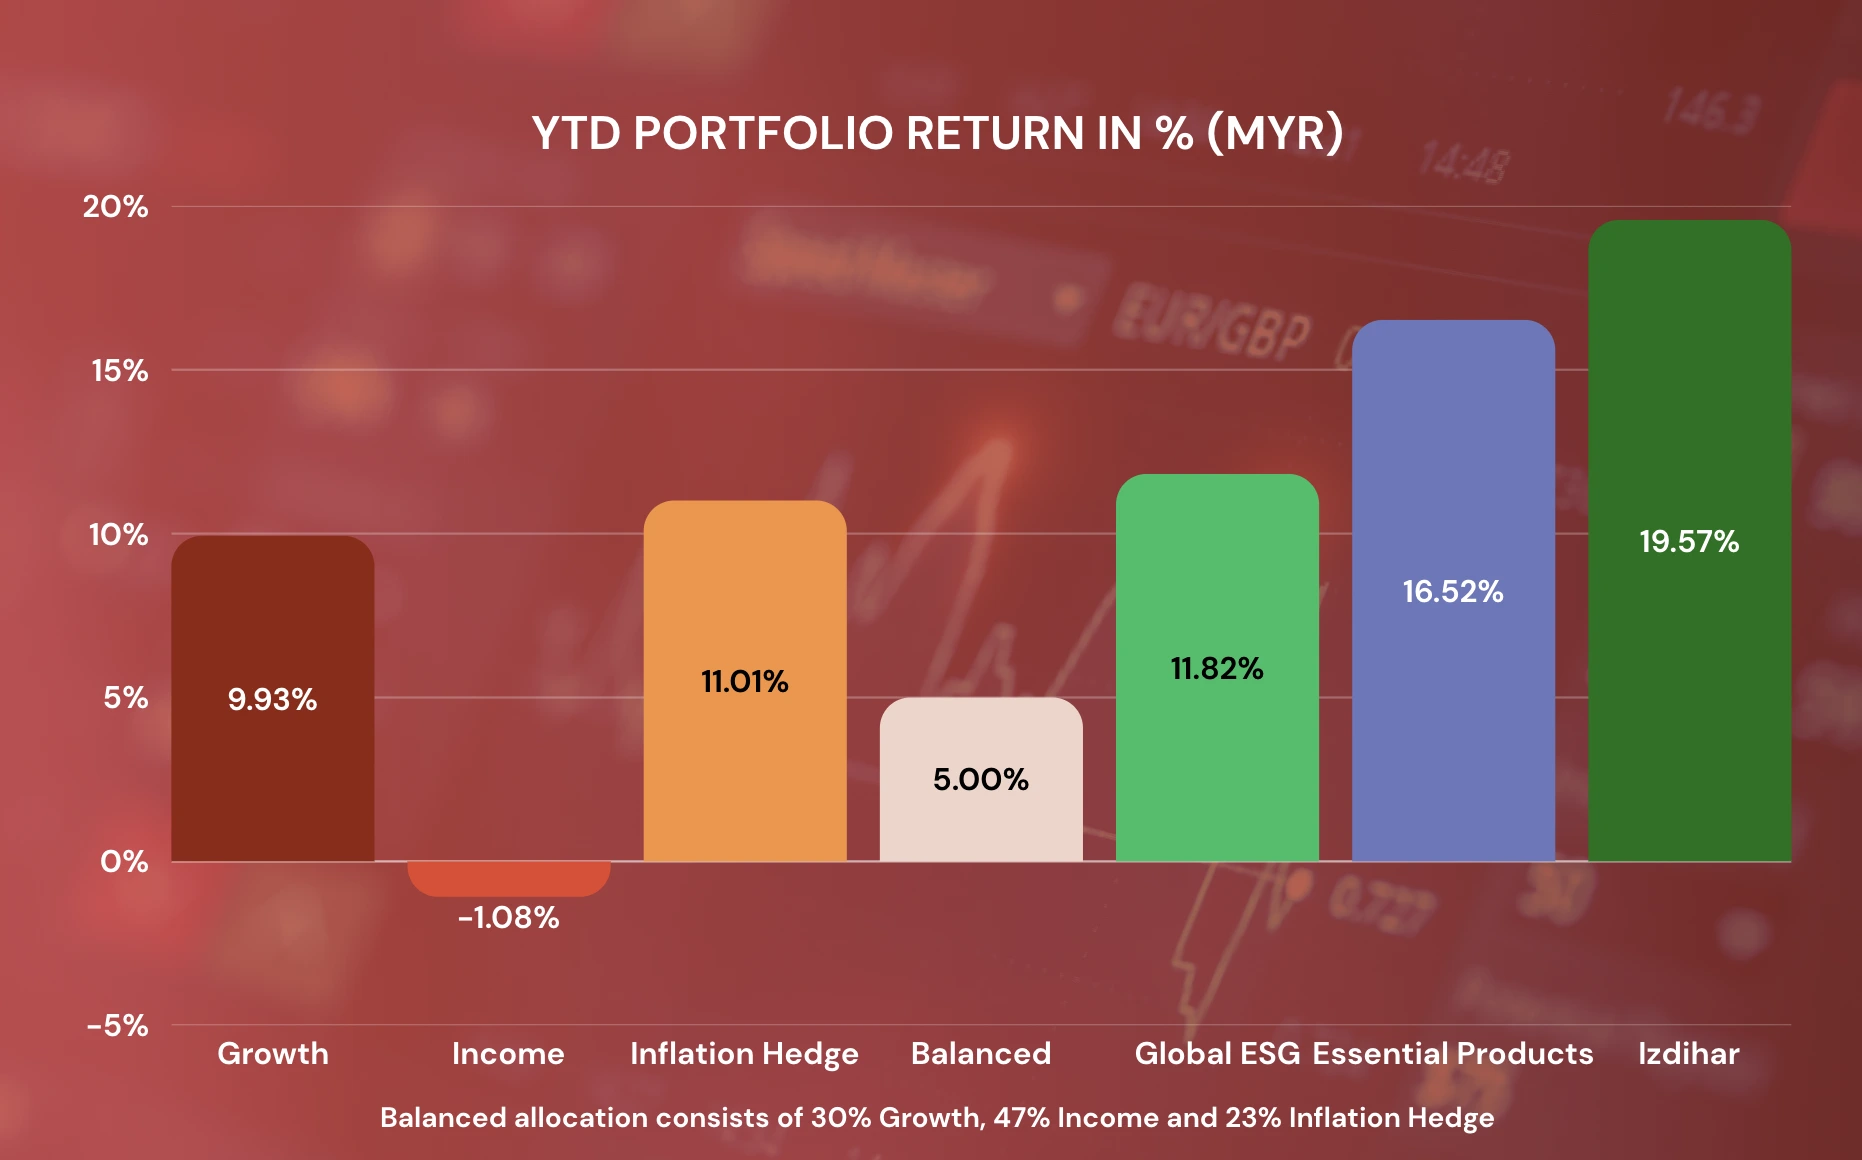
*YTD = Year to Date
*Source: GAX MD Sdn Bhd, data in USD term for the month of May 2026
Past performance is not an indication of future performance.
HOW TO CALCULATE YOUR OMAKASE RETURNS
Your Omakase return is the weighted sum of each portfolio's monthly return. Using the balanced allocation as an example:
For instance, assuming allocations of 30% to the Growth portfolio, 47% to the Income portfolio and 23% to the Inflation Hedge Portfolio, the YTD portfolio return in MYR as of February would be 1.74%. [(30% x 1.38%) + (47% x -2.05%) + (23% x 10.17%)]
Your actual return varies based on your personal allocation and investment timing.
Performance Commentary
After the sharp sell-off in March, markets bounced back strongly in April. The recovery was not just quick, but also more than enough to offset the earlier losses. Most MYTHEO portfolios have now fully recovered what was given up in March.
1. Technology Rally Drives Equity Outperformance
This environment proved exceptionally favourable for the MYTHEO Izdihar Portfolio, which delivered a standout return of 10.25% in MYR, building on its 11.76% gain in April. With over 50% of its allocation directed towards the technology sector, the portfolio was well positioned to benefit from the continued rally. Shariah-compliant technology exposure through SPTE alone gained 15.92%, reflecting strong global demand for AI chips and data centre infrastructure.
The MYTHEO ESG Portfolio also performed well, delivering a return of 4.19% in MYR. Its allocation to growth-oriented US equities, particularly through NULG, allowed the portfolio to benefit from the strong rally in US technology stocks. In addition, its exposure to emerging market equities (ESGE) provided further upside, driven by leading technology names such as Taiwan Semiconductor Manufacturing Company (TSMC) and Samsung Electronics.
Similarly, the Growth Portfolio recorded a solid gain of 3.83% in MYR. Its broad global equity exposure, including a significant allocation to US growth stocks (VUG), enabled it to benefit meaningfully in the same technology-driven upswing.
2. Energy Correction Weighs on Commodity-Linked Portfolios
Oil prices experienced their sharpest monthly decline since November 2021 as hopes for a US-Iran ceasefire agreement gathered momentum. Brent crude fell by more than 25% from above US$124 to near $92 per barrel. The correction was driven by reports of a potential 60-day ceasefire extension and the gradual reopening of the Strait of Hormuz.
This decline directly impacted the MYTHEO Essential Products Portfolio, which recorded a loss of 1.46% in MYR. The portfolio's significant allocation to traditional energy through XLE suffered as the ETF declined 5.63%. Agriculture and water-related exposures also came under pressure, with MOO, VEGI and CGW all posting negative returns. Only the portfolio's clean energy allocation (ICLN) provided a meaningful offset, surging 13.48% on AI-related electricity demand forecasts.
The Inflation Hedge Portfolio experienced a marginal decline of 0.23% in MYR. While its crude oil exposure through DBO fell 5.50%, this was partially offset by a strong 13.48% gain in clean energy (ICLN) and a 4.46% rise in base metals (DBB). Precious metals continued to correct, with Gold (IAU) declining 1.57%, extending the pullback from January's all-time highs. Fixed Income Steadies Despite Concern Over Inflation and Interest Rate Direction.
The US Federal Reserve kept its benchmark rate at 3.50% to 3.75%, while inflation remained elevated at 3.8% year on year. This has led more policymakers to push back against near-term rate cuts, keeping bond market conditions tight. As a result, US 10-year Treasury yields moved higher, rising above 4.45%. Despite this challenging backdrop, the MYTHEO Income Portfolio delivered a modest gain of 0.41% in MYR. Performance was supported by a diversified mix of investment-grade corporate bonds (LQD) and emerging market debt (EMLC), which helped offset the pressure from rising US Treasury yields. In addition, the portfolio’s exposure to floating rate instruments (FLOT) provided an important source of stability, as these assets benefit from higher interest rates through periodic yield adjustments. Taken together, this positioning helped the portfolio remain resilient and continue delivering income, even as the rate environment remained unfavourable for traditional fixed income assets.
3. Conclusion
May 2026 reinforced the strategic value of investing across different asset classes. The month saw a sharp divergence between technology winners and commodity laggards. Against this backdrop, the breadth of exposure across asset classes, investment themes, and geographies allowed MYTHEO portfolios to capture meaningful upside while cushioning weakness in more challenged segments of the market.
The Izdihar Portfolio’s exceptional 10.25% return shows how strong thematic positioning can translate into outsized gains when market conditions are supportive. For investors in Essential Products and Inflation Hedge, the monthly decline should be viewed in context. Both strategies remain firmly positive year to date at 16.52% and 11.01%, indicating that they have already captured a meaningful share of this year’s positive momentum. Short-term pullbacks are a natural part of market cycles, and investment returns do not move in a straight line.
Not every strategy will outperform in every market environment. This variation is a natural outcome of diversification, and one of the reasons diversified portfolios are better positioned to deliver smoother and more resilient long-term outcomes.
Appendix
ETF Performance Summary by Portfolio | May 2026
1. Growth Portfolio
RISK: HIGH | Diversified global equities
2. Income Portfolio
RISK: LOW | Global fixed income & bonds
3. Inflation Hedge Portfolio
RISK: MEDIUM | Real assets & commodities
4. ESG Portfolio
RISK: HIGH | Global equities — sustainable & responsible investing
5. Essential Products Portfolio
RISK: HIGH | Commodities, energy & agriculture
6. Izdihar Portfolio
RISK: HIGH | Shariah-compliant global equities
*Returns are in USD terms for the month of May 2026.
Top and Bottom performers ranked by 1-month return within each portfolio. Past performance is not indicative of future results.
Ready to explore how MYTHEO works for your goals? Learn more here.
Or download our app so you can start investing in a moment. Download on iOS here or Android here.
*Past performance is not indicative of future results. All investments involve risk, including possible loss of principal.
This material is subject to MYTHEO’s Notice and Disclaimer.